Iberian Peninsula: Neolithic Iberian → Chalcolithic Iberian → Bell Beaker culture → Bronze Age Iberian
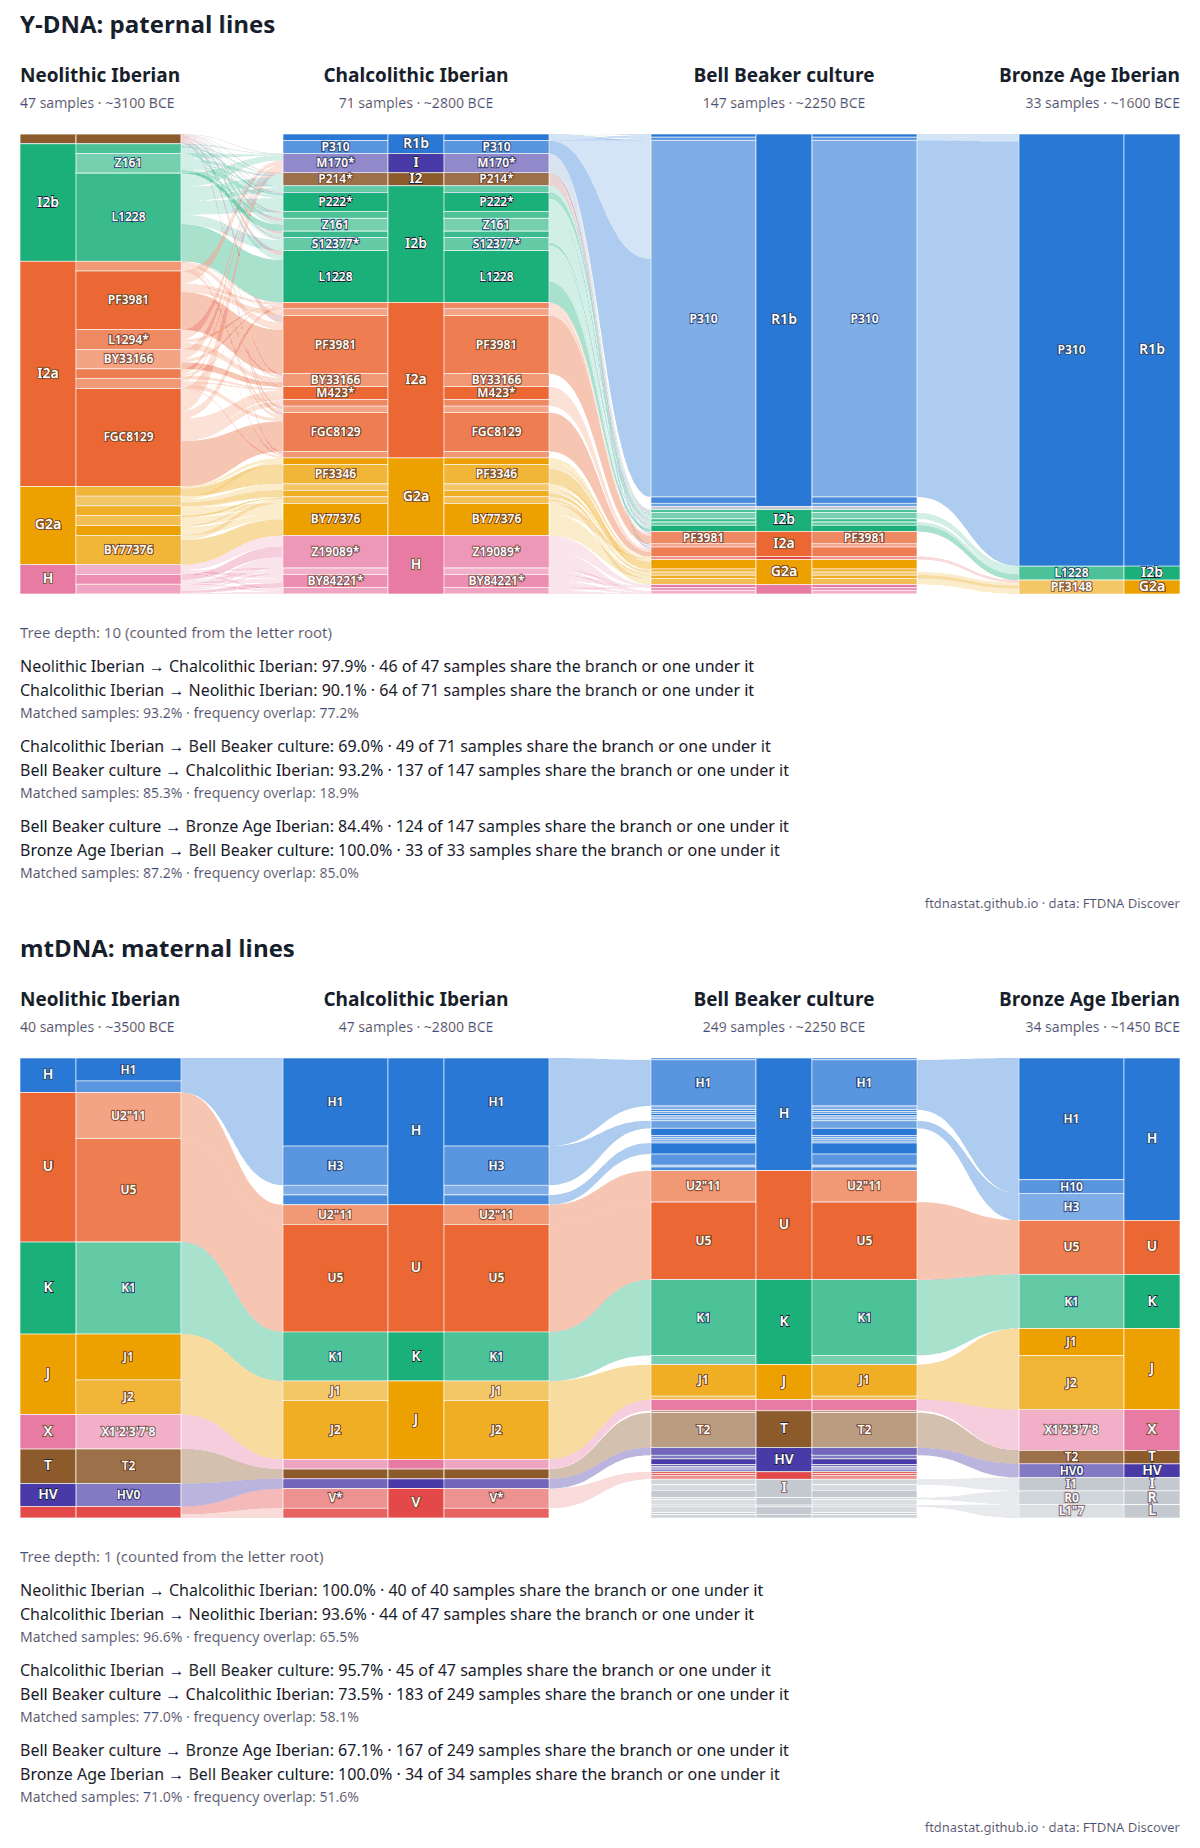
From the Neolithic to the Copper Age the male lines of Iberia barely change: 77% in common, with I2a, I2b and G2a in the lead both times. The Bell Beaker men share only 19% with the local Copper Age. The peninsula's Bronze Age, by contrast, repeats the Beakers at 85%, and 94% of its samples are R1b.
Loading the ancient samples…
Nothing picked yet #
Start with an example:
Y-DNA: paternal lines
Table of shares
mtDNA: maternal lines
Table of shares
How to read the chart
Each sample is cut to its ancestor at the chosen depth; a sample whose test did not reach that deep stays on its own branch. An asterisk: in this culture the branch also has samples further down. “A → B” is the share of A's samples with a branch of the same line in B: the same branch, its ancestor or a branch under it. A sample whose test stopped higher could belong to any branch under it, so it matches them. The frequency overlap sums the smaller share of every shared branch, such a sample's share split among the branches under it by their shares in both cultures together; it is less swayed by single samples. By age, a sample moves up to the ancestor whose branch had already split off by the chosen year (branch ages are Discover estimates), so every letter is cut at the same time. “Auto” takes the time of the oldest culture chosen, or earlier if a column would not read otherwise. Maternal lines follow the Mitotree tree of FTDNA Discover.
The chain in numbers #
Y-DNA, tree depth 10. Similarity is the overlap of branch frequencies with the culture before.
| Culture | Samples | Leading groups | Similarity with the previous |
|---|---|---|---|
| Neolithic Iberian | 47 | I2a 48.9%, I2b 25.5%, G2a 17.0% | — |
| Chalcolithic Iberian | 71 | I2a 33.8%, I2b 25.4%, G2a 16.9% | 77.2% |
| Bell Beaker culture | 147 | R1b 81.0%, I2a 5.4%, G2a 5.4% | 18.9% |
| Bronze Age Iberian | 33 | R1b 93.9%, I2b 3.0%, G2a 3.0% | 85.0% |
Other chains
- Carpathian Basin: Avars, early period → Avars, late period → Hungarians → Medieval Hungarian
- Pontic steppe: Srubnaya → Scythians → Sarmatians
- Central Europe, Bronze and Iron Age: Unterwölbling culture → Urnfield culture → Hallstatt culture → La Tène culture
- Central Europe, dawn of the Bronze Age: Corded Ware culture → Bell Beaker culture → Únětice culture
- Danube, first farmers: Iron Gates Mesolithic → Starčevo culture → Linear Pottery culture
- Steppe from the Dnieper to the Urals: Yamnaya culture → Catacomb culture
- Italy: Etruscan civilization → Roman people → Medieval Italian
- Scandinavia and Rus’: Iron Age Scandinavian → Viking Age Swedish → Viking Age Russian